Built from scratch. Managed by Nick Garcia. A closer look at seven Pinterest channels spanning health, food, home and design.
Figures transcribed from supplied Pinterest Analytics screenshots. Each example keeps its own reporting period. Outbound clicks are Pinterest-reported clicks to destinations; they are not a count of unique visitors, leads or sales.
All seven channels featured here were grown from scratch and are managed by Nick Garcia. They demonstrate hands-on account-building experience across multiple niches.
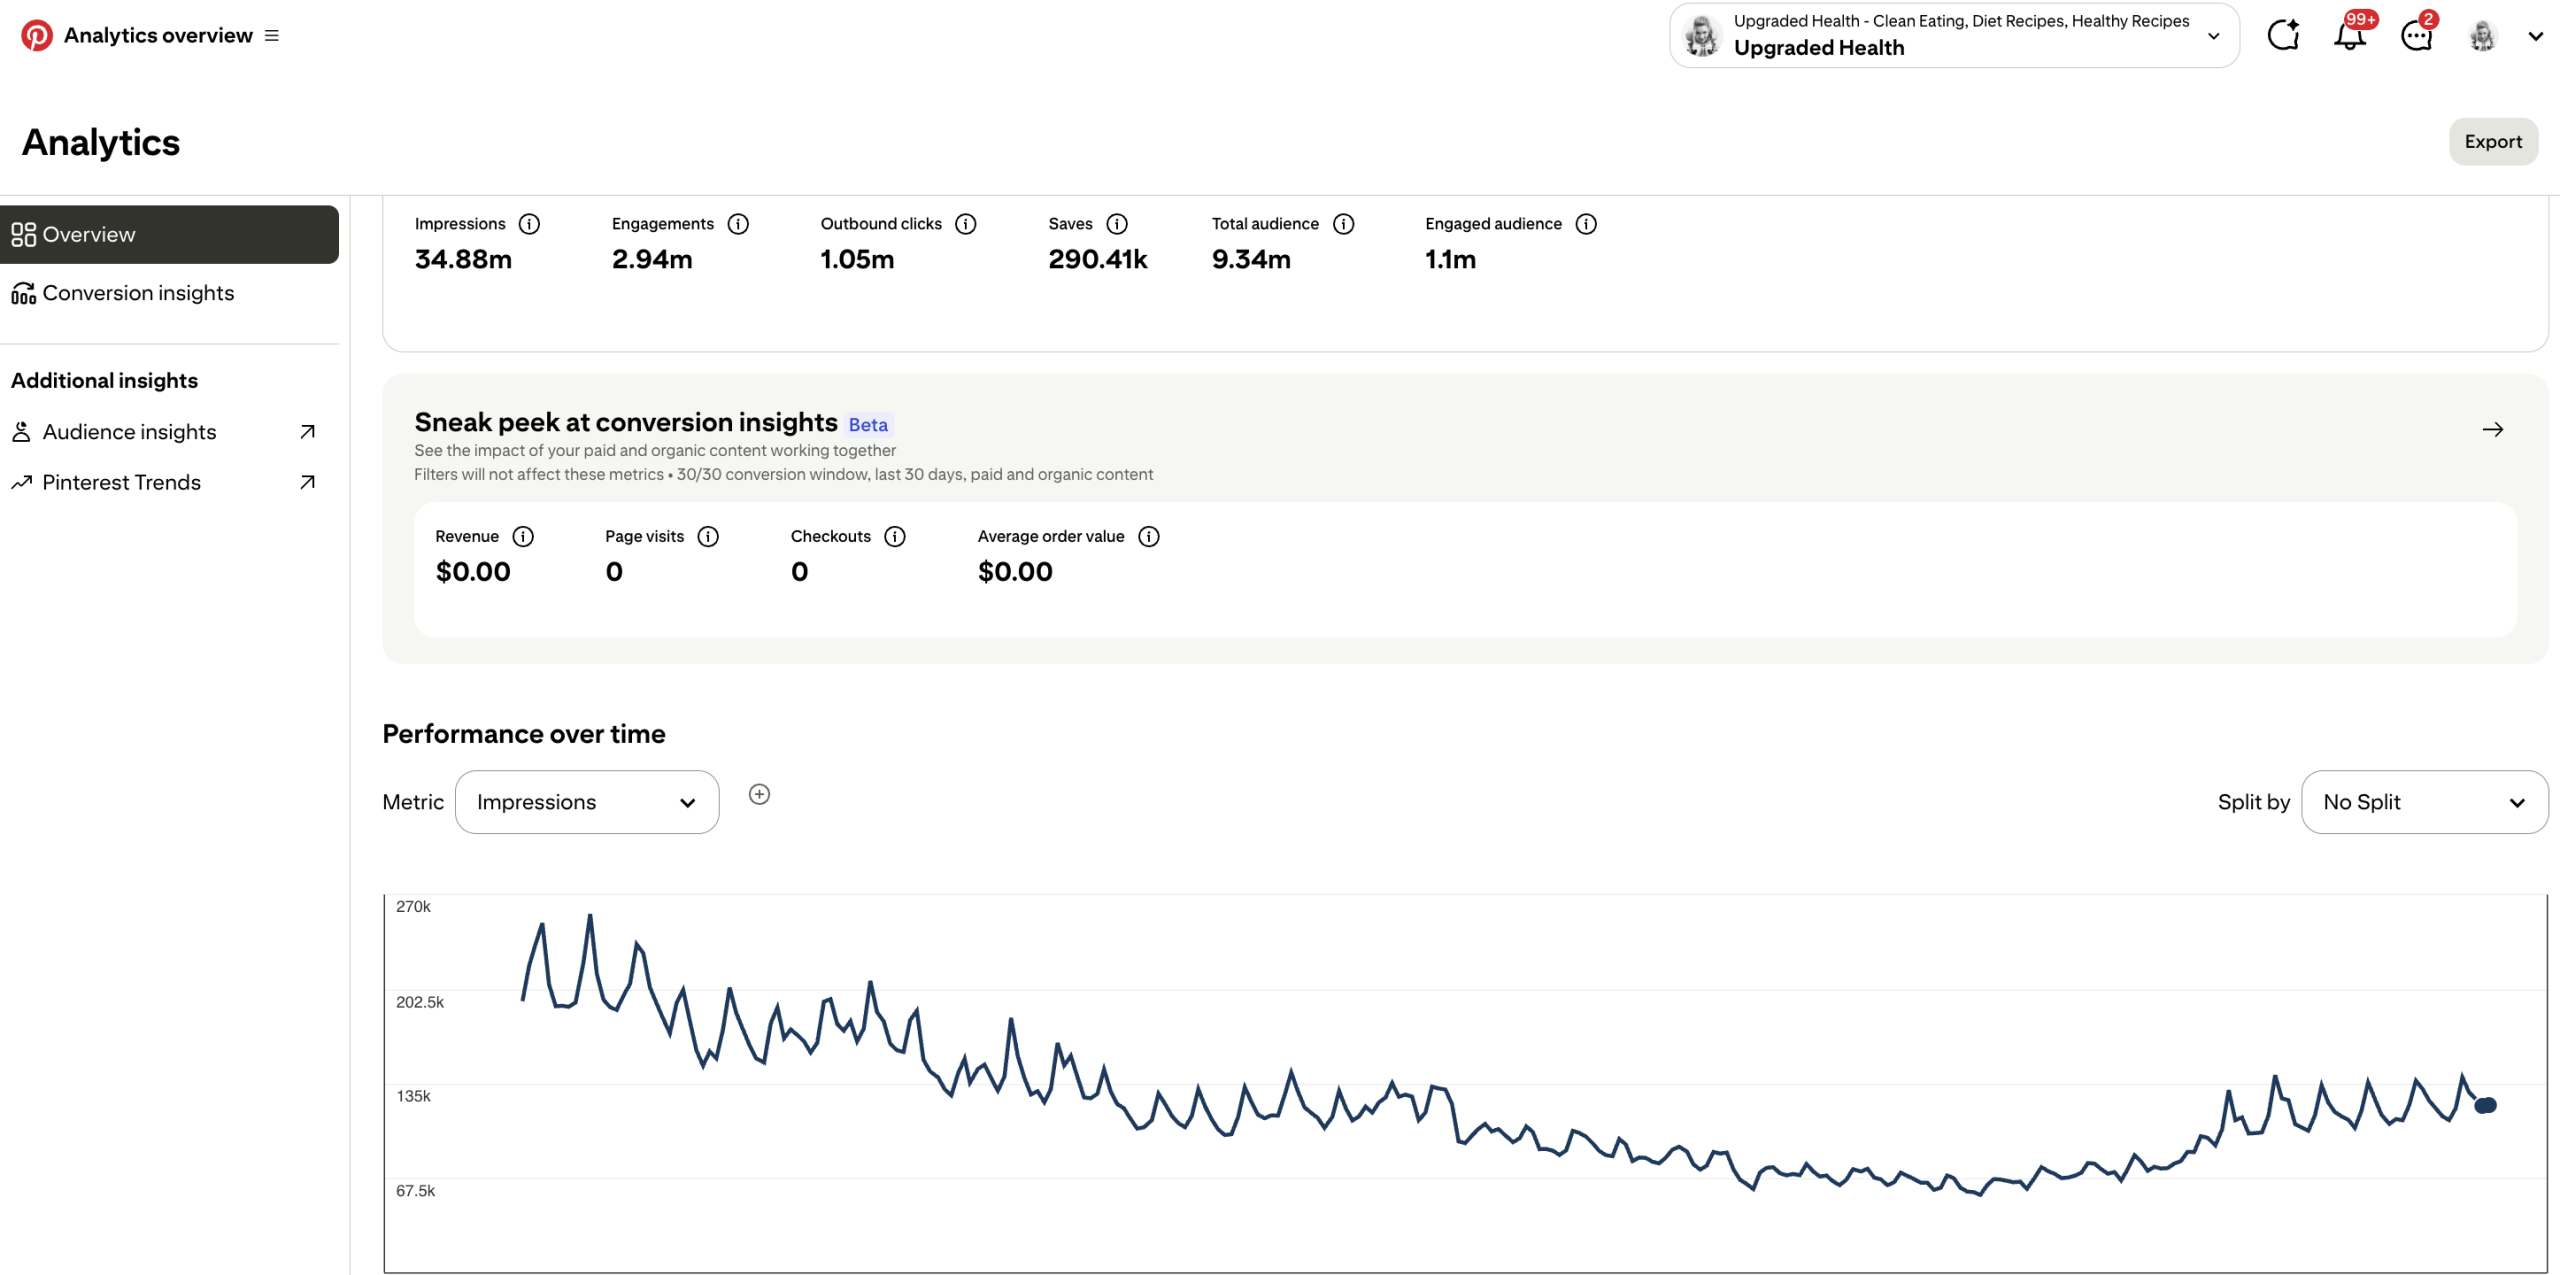
Featured channel: Upgraded Health
1.05 MILLION
outbound clicks from Pinterest
34.88 million impressions
Plus 290.41K saves and 2.94 million engagements in the selected reporting period.
Source: supplied Upgraded Health Pinterest Analytics screenshot. Reporting dates are not visible in the supplied screenshot. These are cumulative figures for the selected period, not monthly totals.
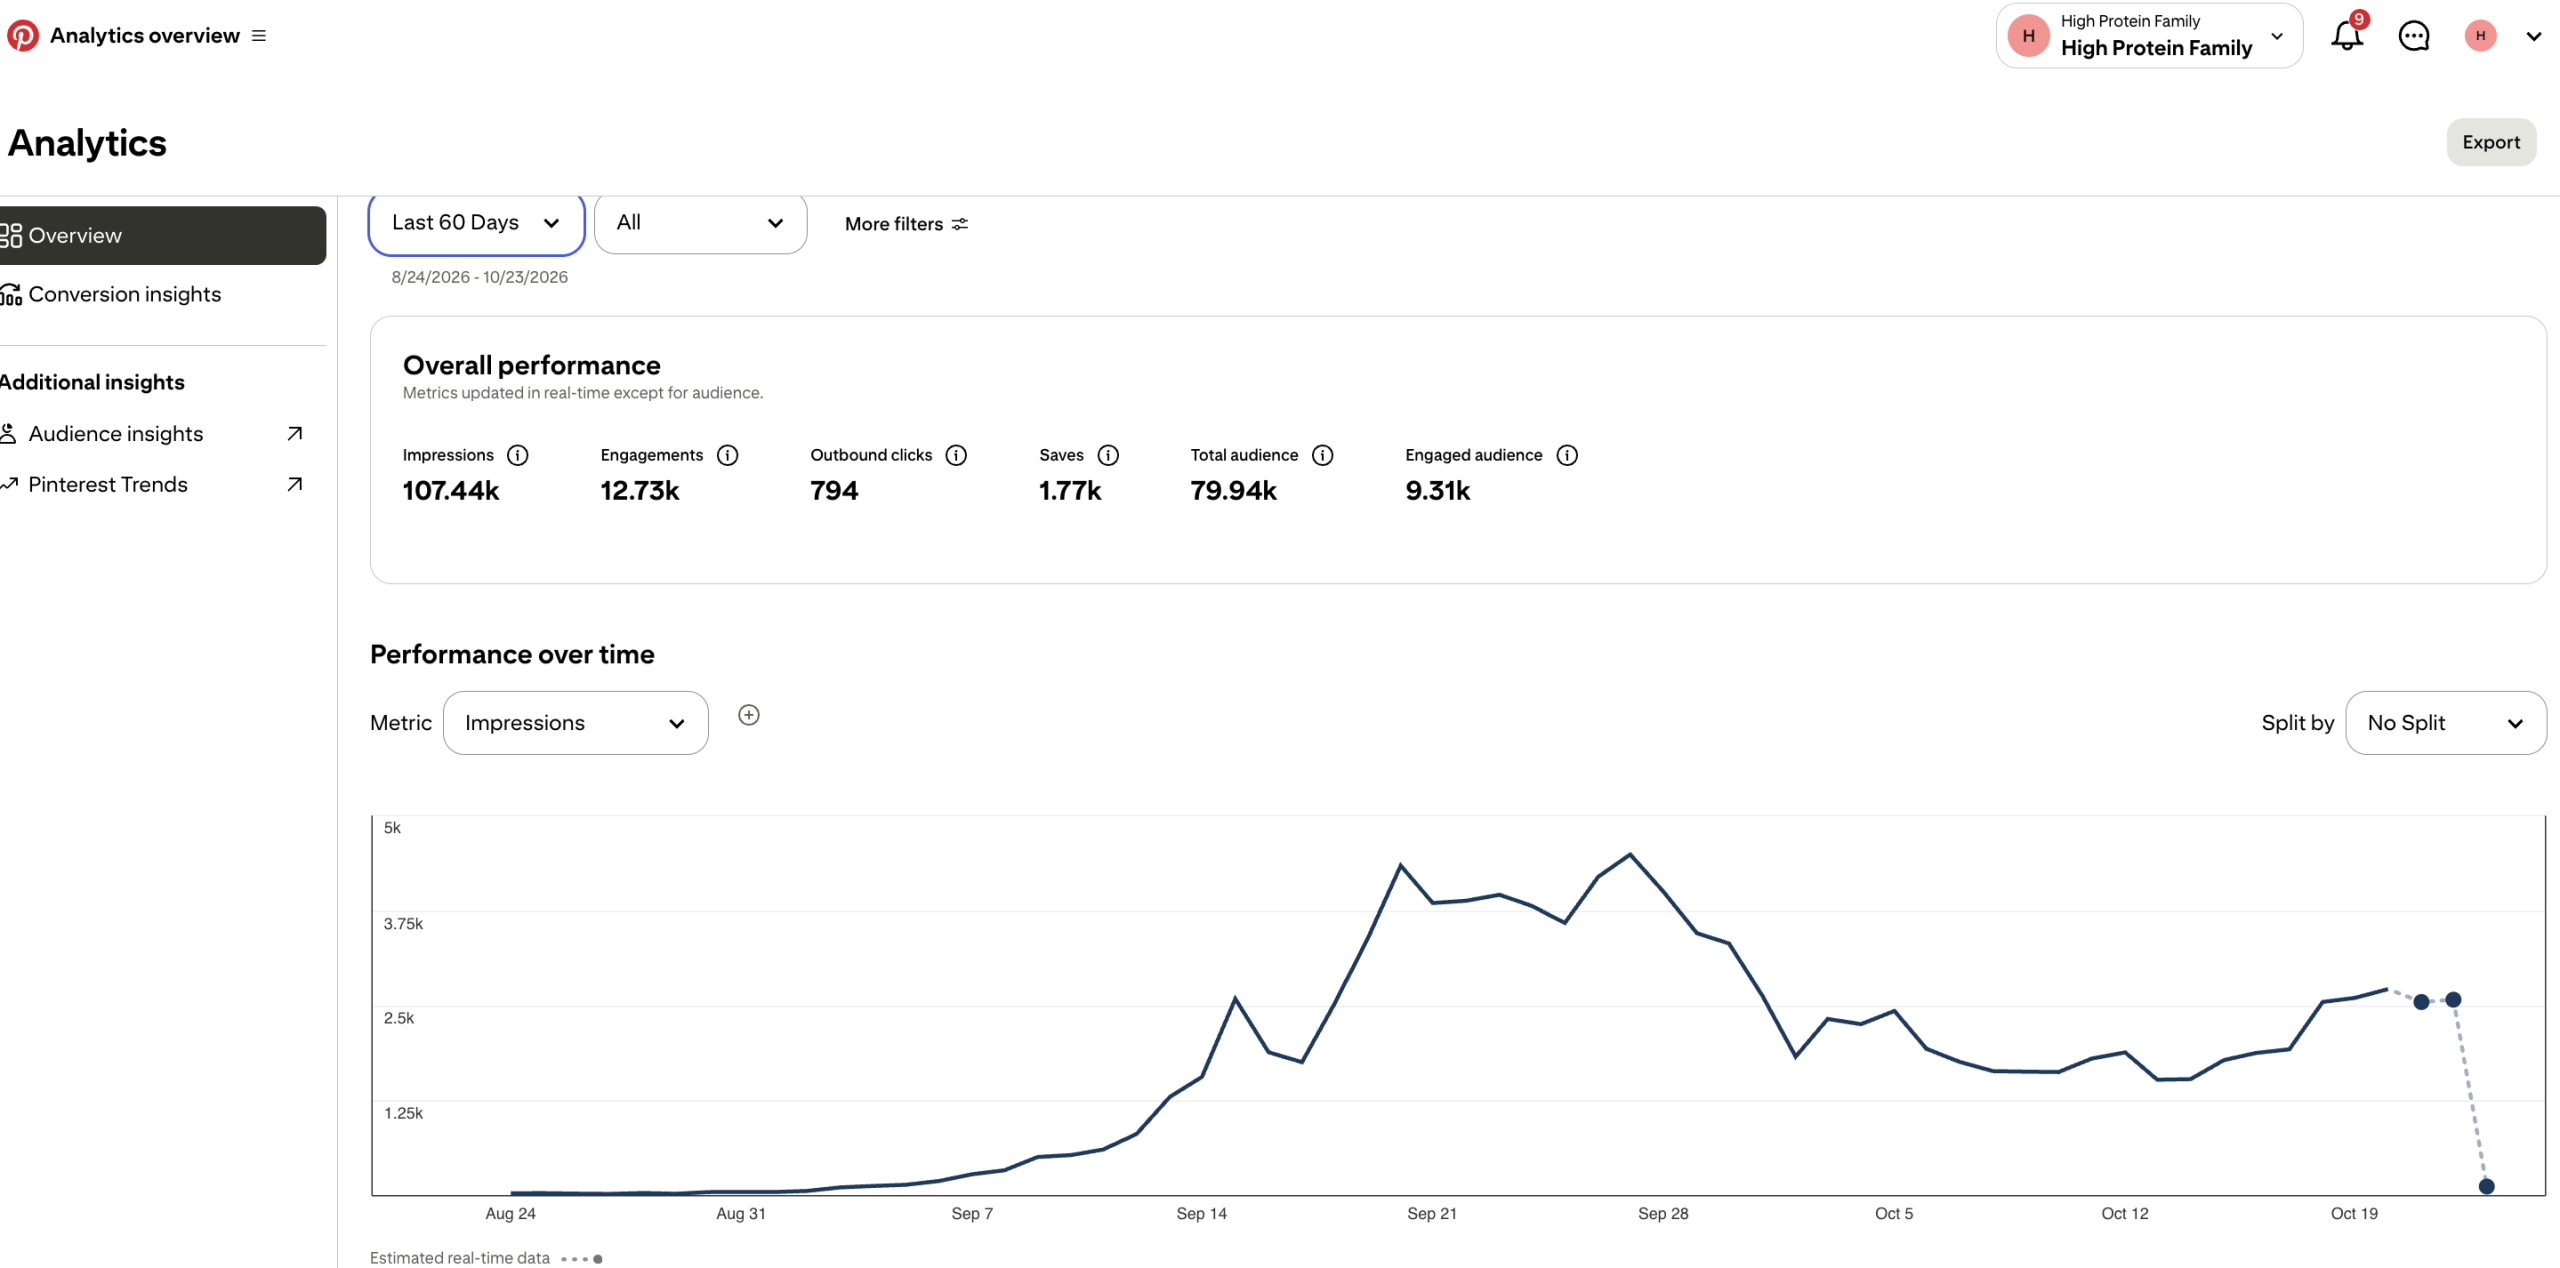
High Protein Family
Early traction: 107.44K impressions and 794 outbound clicks
August 24–October 23, 2026 · Pinterest’s “Last 60 Days” view
The selected period shows 107.44K impressions, 794 outbound clicks and 1.77K saves. The chart begins near zero and shows a rise in activity during September. Nick built this account from scratch and continues to manage it. The reporting window shows activity during this period, not the account’s full lifetime.
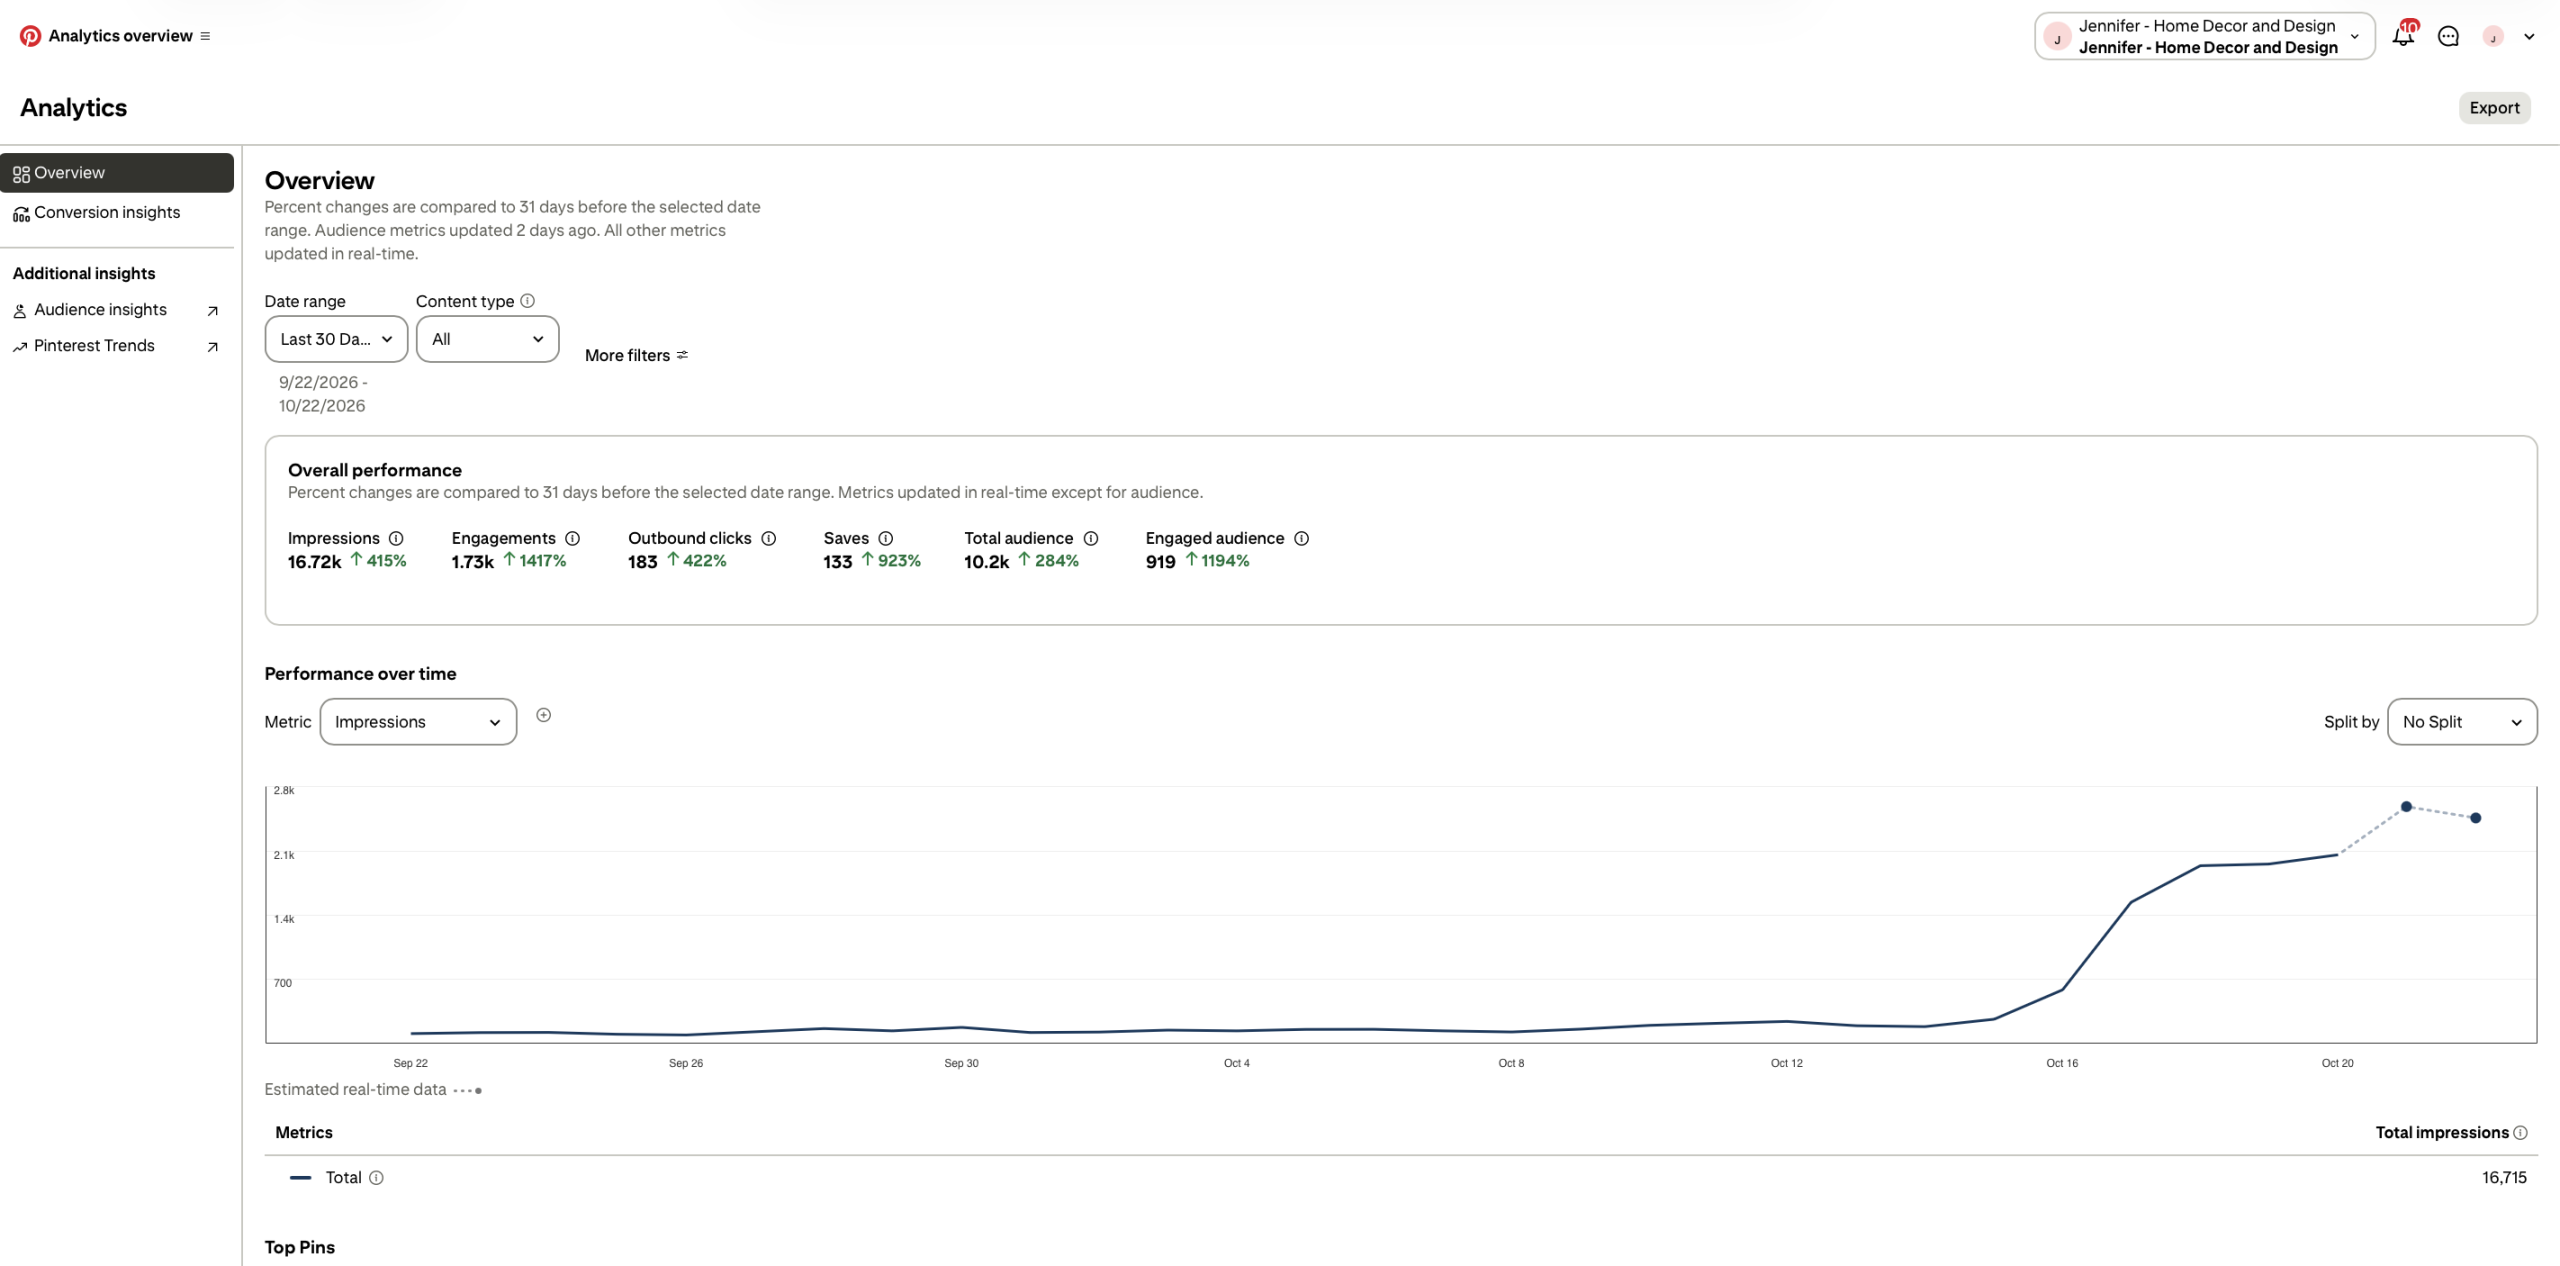
Jennifer – Home Decor and Design
Outbound clicks increased 422%
September 22–October 22, 2026 · compared with the preceding 31-day period
183 outbound clicks, up 422%; 16.72K impressions, up 415%; and 133 saves, up 923%. A useful example of growth from a smaller starting point. The percentage is Pinterest’s displayed comparison, not a claim that the account began at zero.
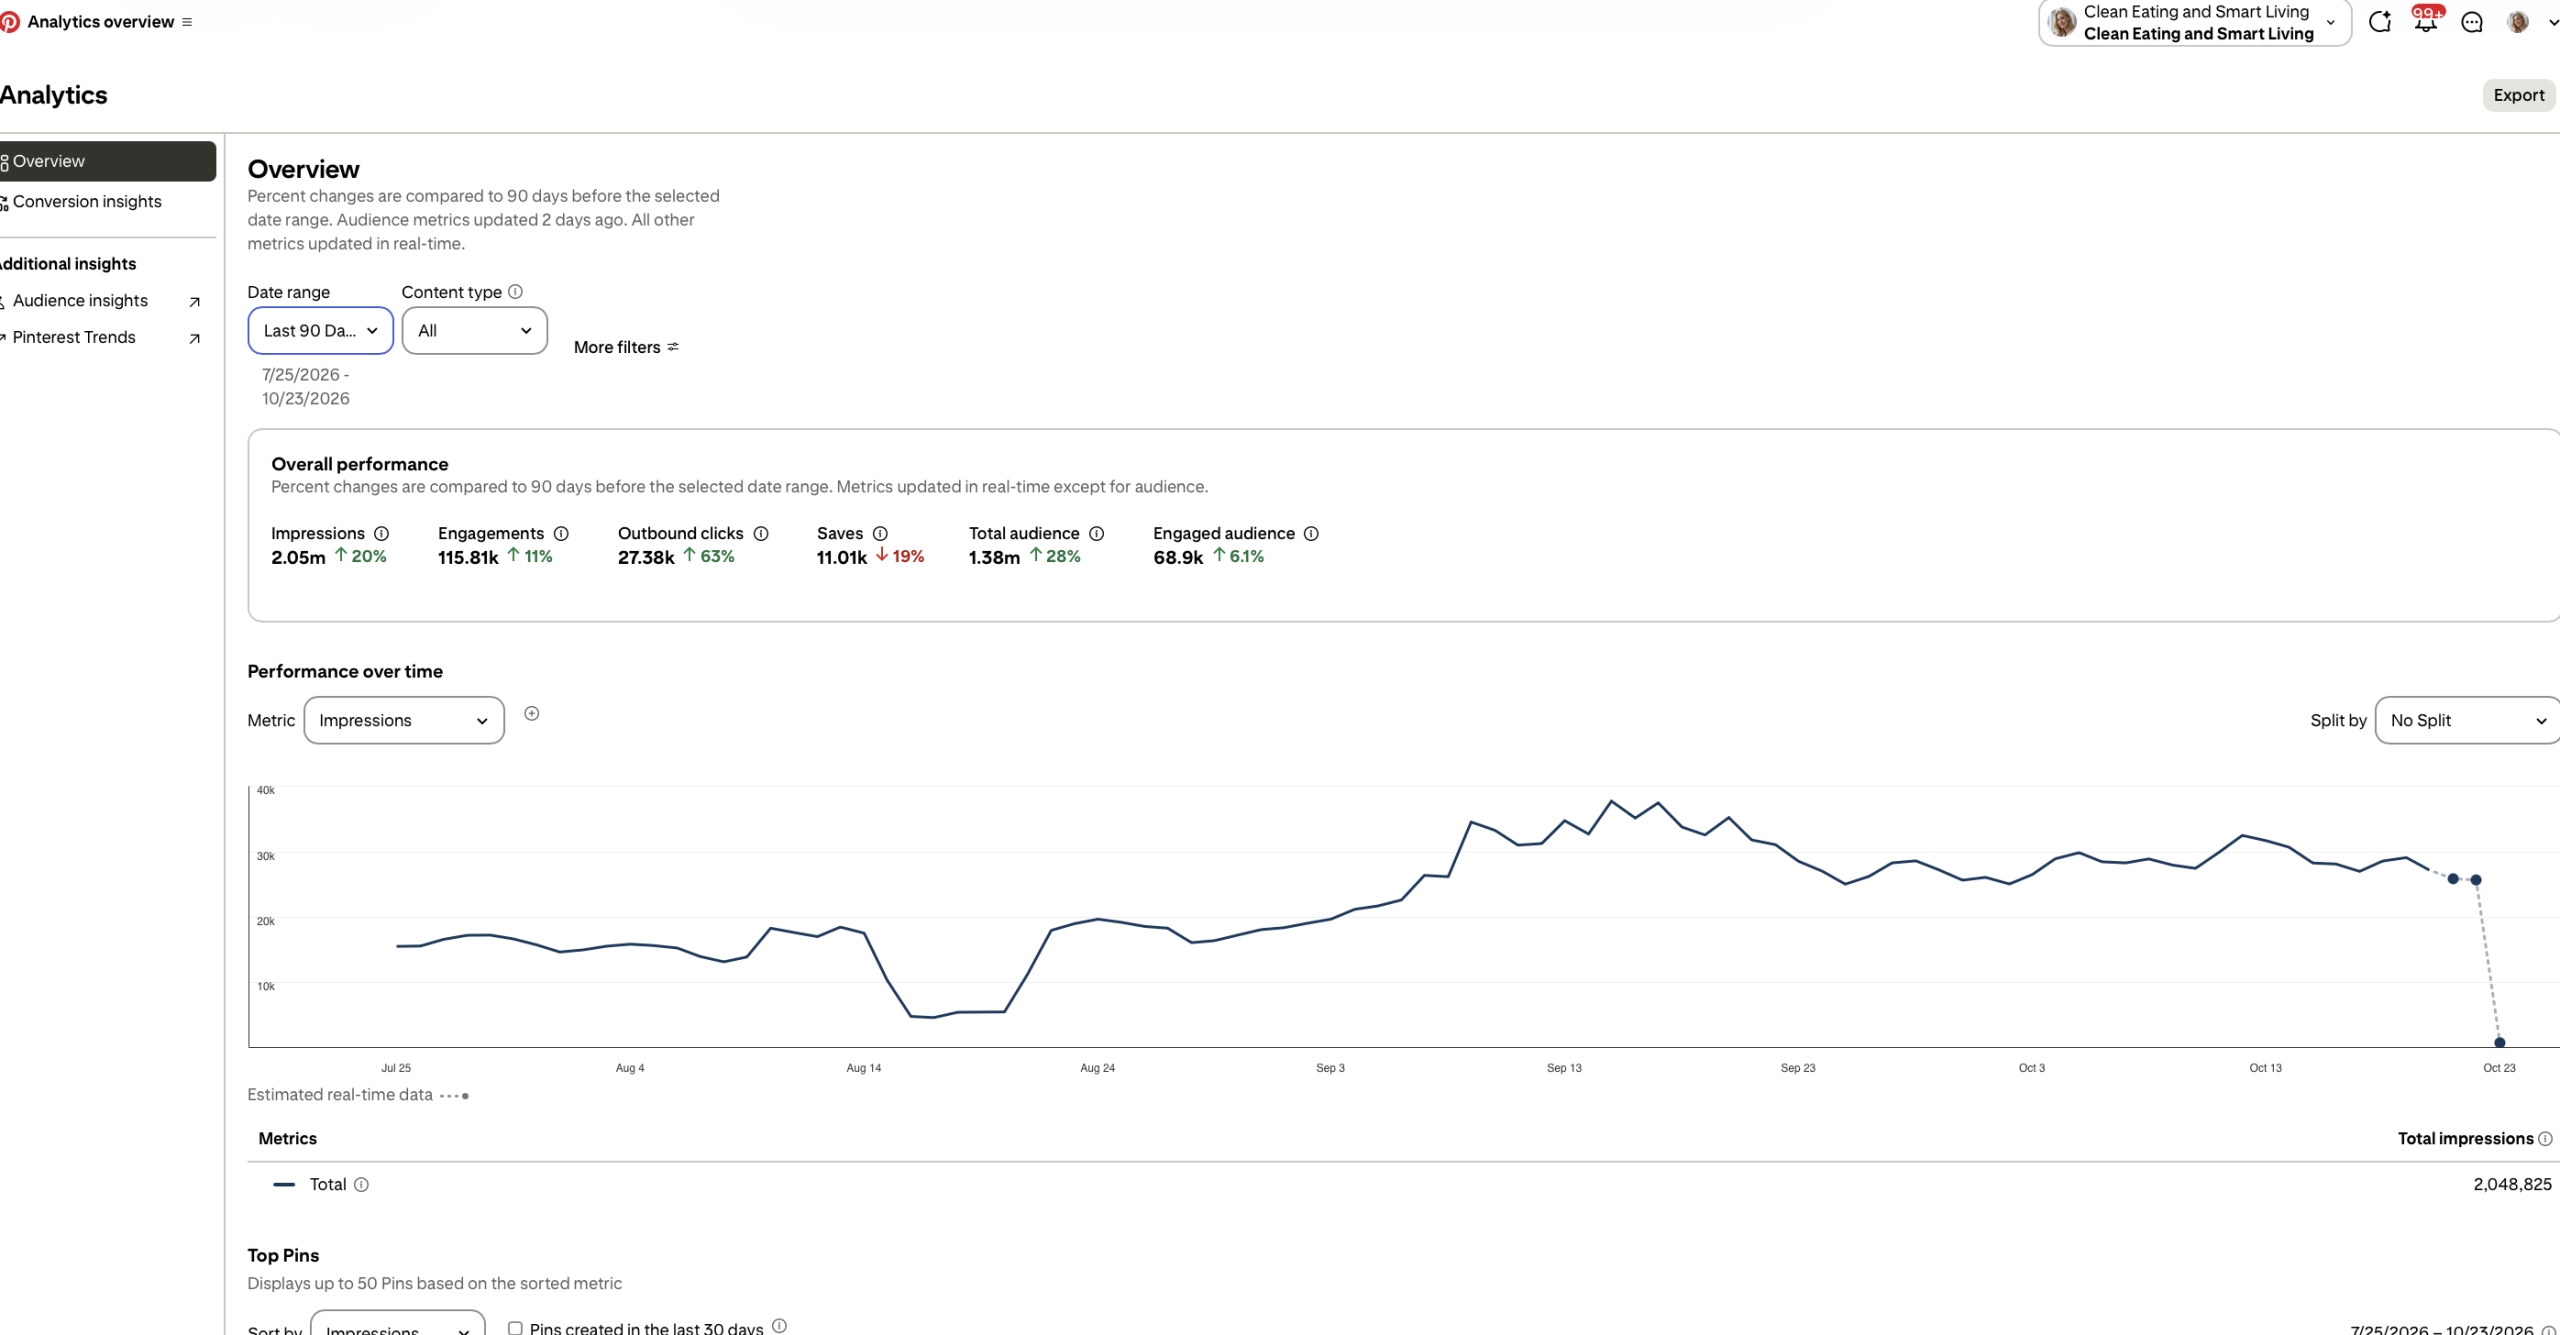
Clean Eating and Smart Living
27.38K outbound clicks in a 90-day reporting window
July 25–October 23, 2026 · compared with the preceding 90 days
Outbound clicks increased 63% to 27.38K. Impressions reached 2.05M, up 20%. Saves were 11.01K, down 19%. This example puts website-directed clicks ahead of impressions alone and shows that individual metrics can move in different directions.
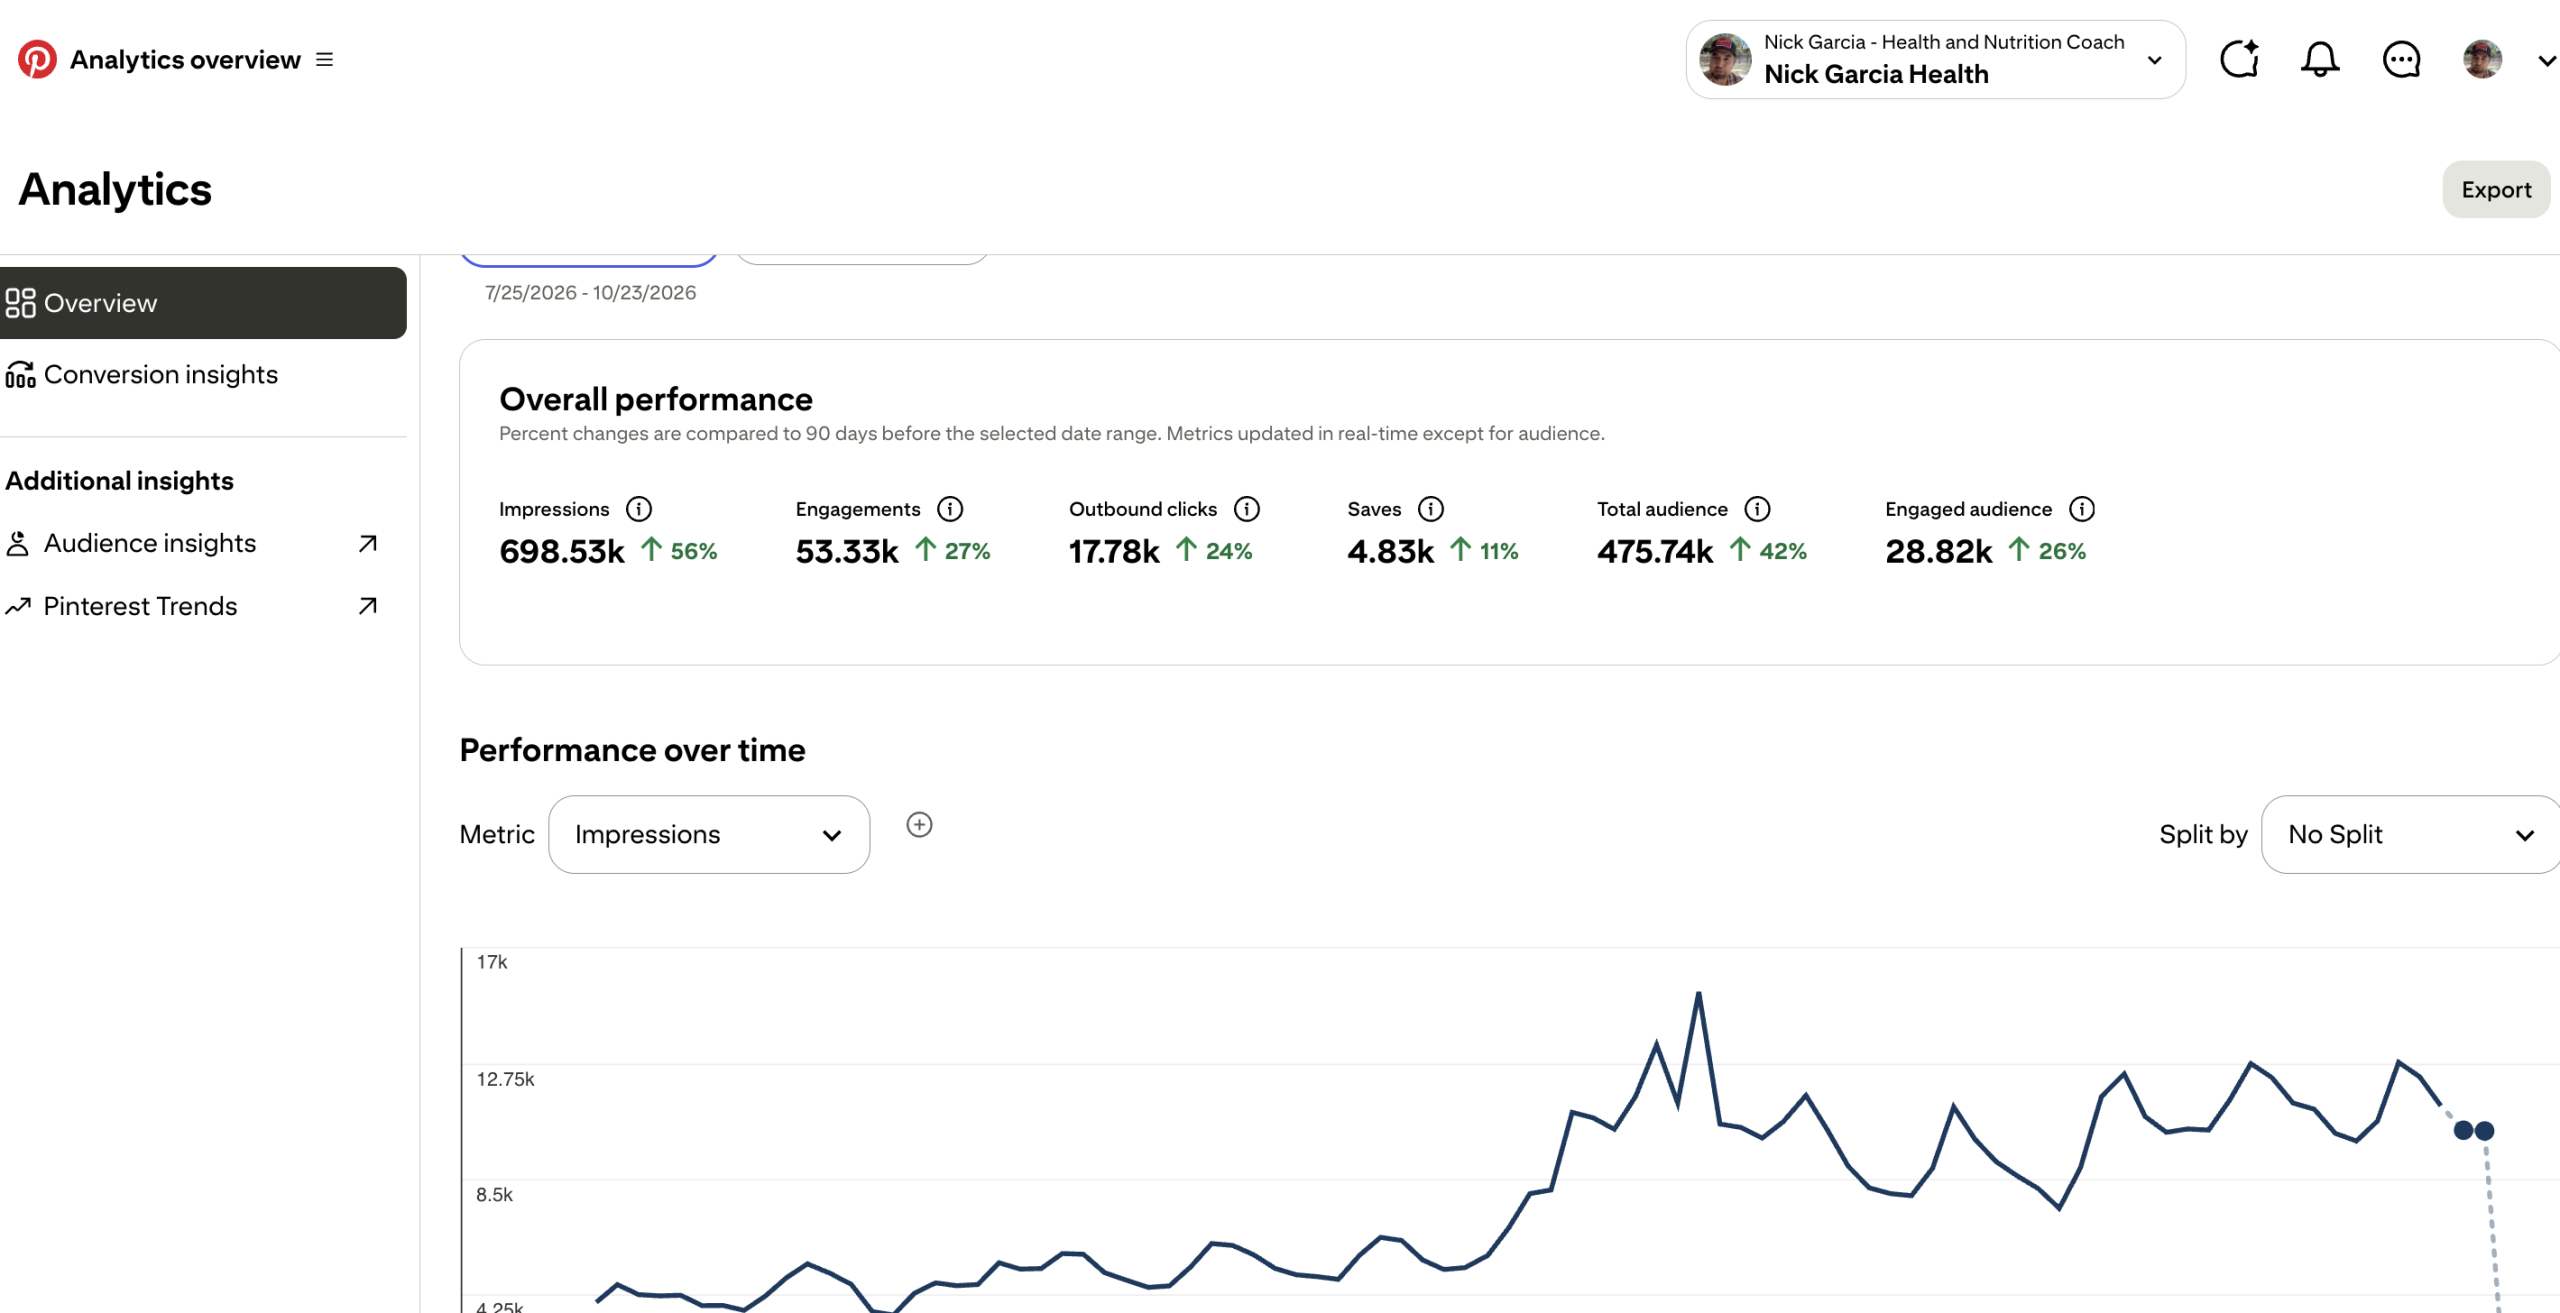
Nick Garcia Health
17.78K outbound clicks, up 24%
July 25–October 23, 2026 · compared with the preceding 90 days
698.53K impressions, up 56%; 17.78K outbound clicks, up 24%; and 4.83K saves, up 11%. A second example of growth across a longer reporting window.
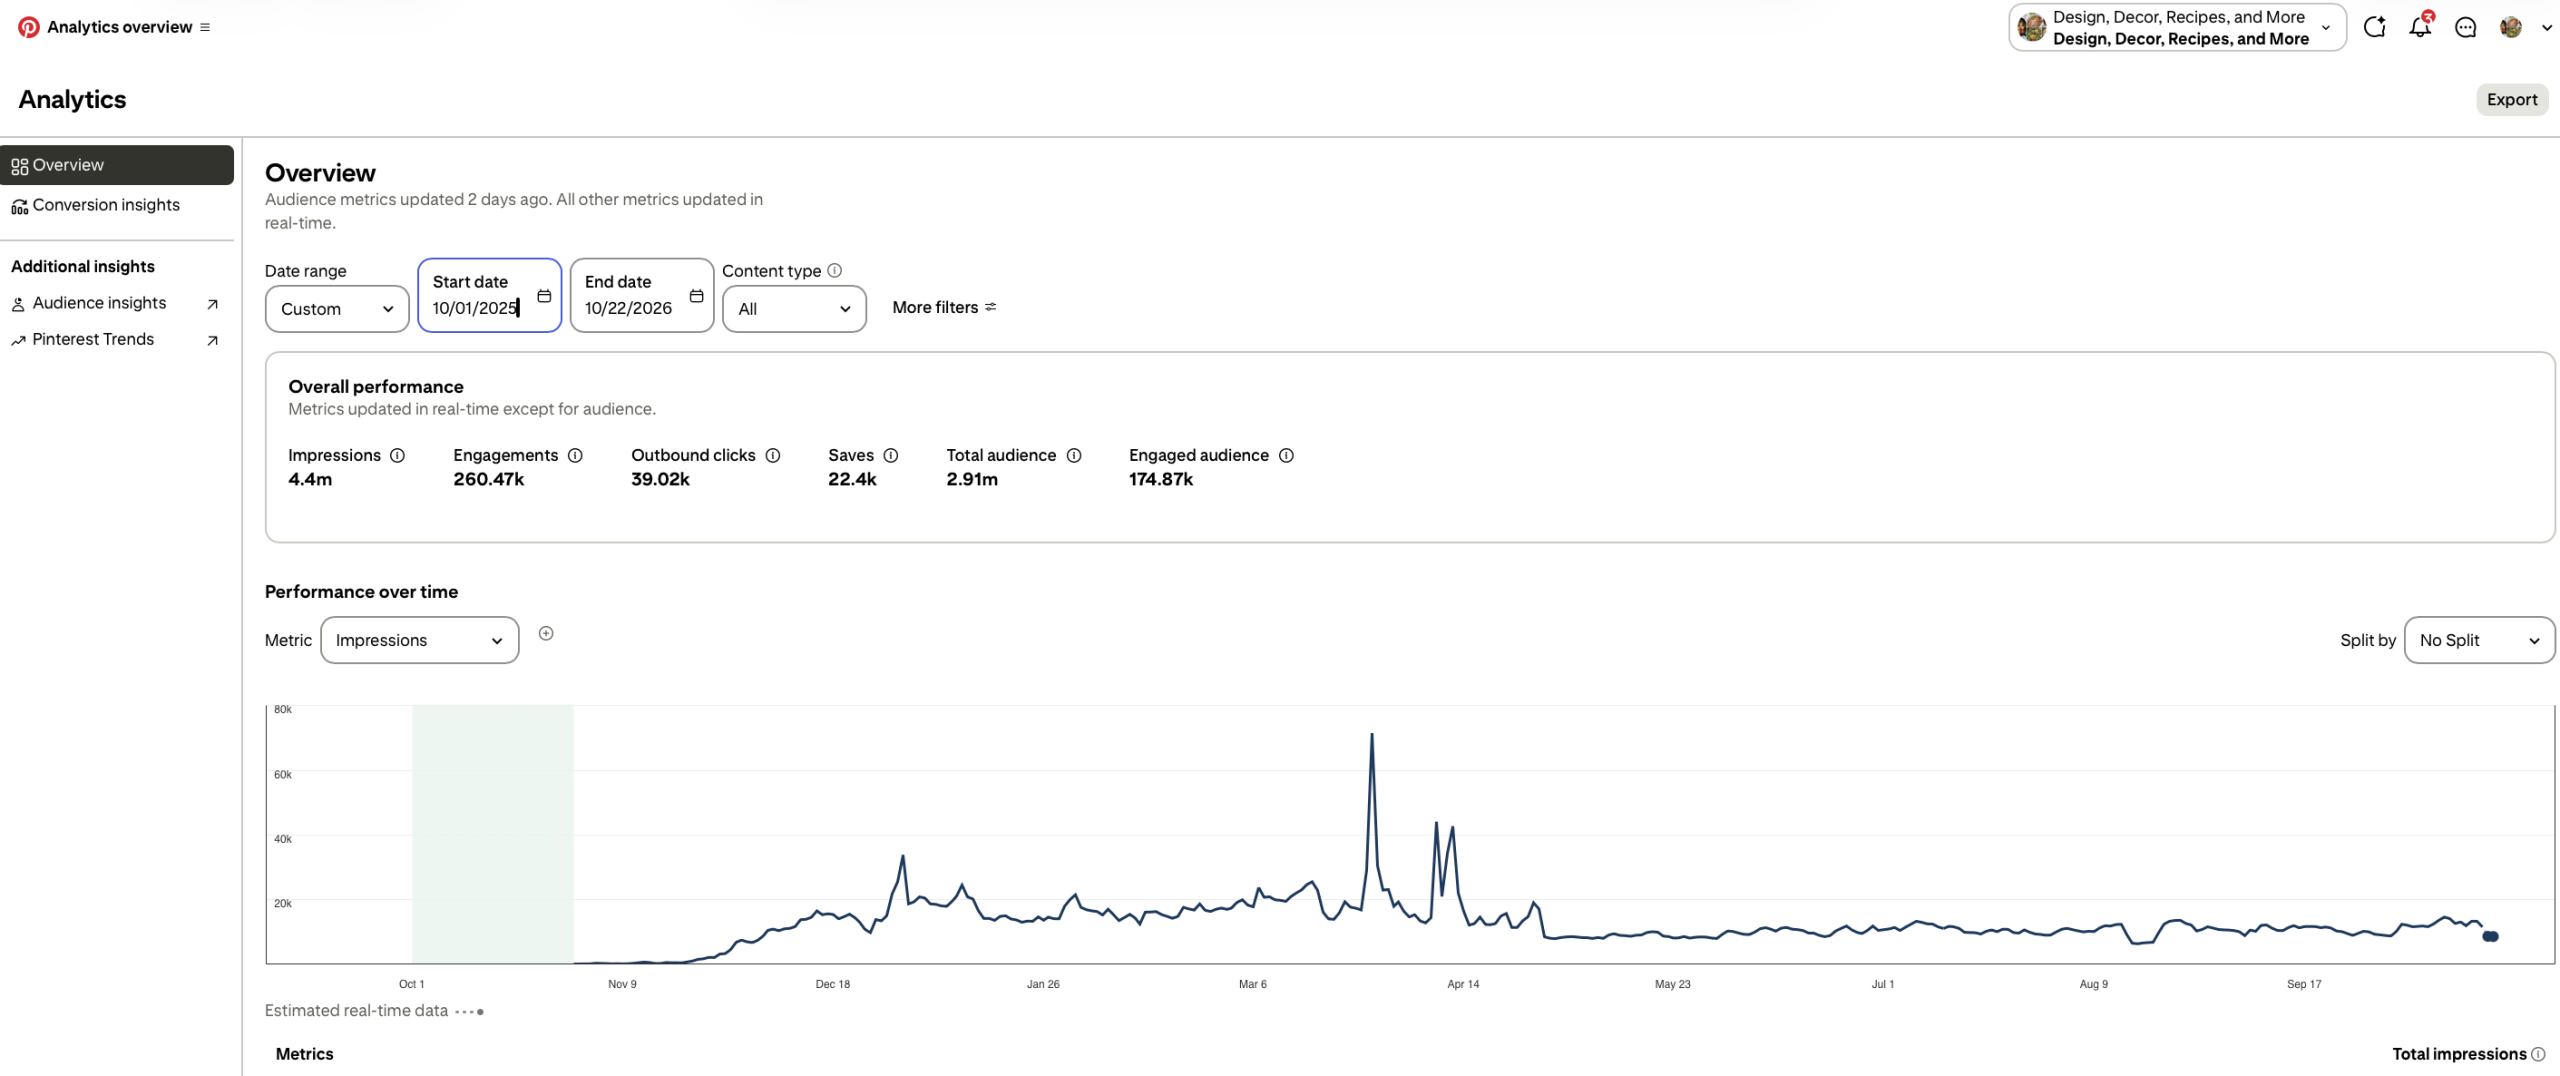
Design, Decor, Recipes, and More
39.02K outbound clicks across the selected period
October 1, 2025–October 22, 2026 · custom date range
4.4M impressions, 39.02K outbound clicks and 22.4K saves. This is a cumulative result for the displayed custom range, not a monthly or 90-day total. No percentage comparison is shown.